Portfolio Matrices
Matrices are very often associated with the practice of strategy. A good strategist would have to produce nice looking charts and arrays from which the purpose a firm and key management actions can be derived and illustrated. Reality has become a bit different though. Nowadays, people have learned to become cautious - even sometimes skeptical - when they see nice looking charts.
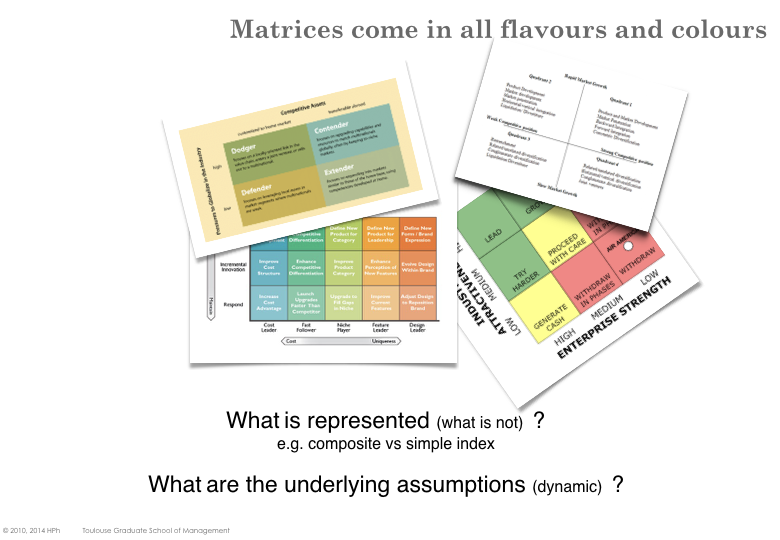
It is however important to recognize the most common matrices and understand what they represent (and may be even more important what they don’t represent).
A matrix can be used to visualize the current status of a firm’s portfolio. A two- axes matrix is a mean of representation: it projects more than two dimensions on a plane. Strategy matrices, however, are also often used as prescription tools : the various quadrants of the matrix call for different management actions. It is then absolutely paramount to understand what are the underlying assumptions that drive such recommendations. Applying a corpus of recommendations to a situation that doesn’t meet the pre-requisite or doesn’t correspond to the situation for which the tool was designed, can lead to very counter productive decisions.
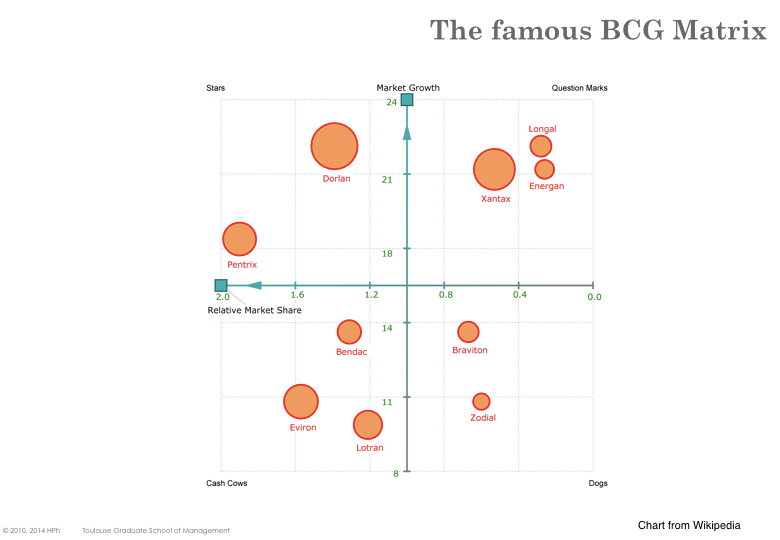
BCG Matrix
The Growth Share chart (aka BCG Matrix) was created by Bruce Henderson (the founder of the Boston Consulting Group) in the early 70’s.
The chart relies on two axes : the relative market share and the growth rate of the market. It is noteworthy that while the market share can be computed from current data (although it is not always easy to figure out the revenues generated by competitors) the (future) growth of the market is more subjective (should the growth remain stable? increase? decrease? On what rationale?).
The focus with this tool is on cash (profit) and on ensuring the proper identification / balance of cash generating vs. cash consuming activities.
The two major underlying assumptions are that
Unit costs are mainly driven by economies of scale. Hence the competitor that controls the bigger volume can enjoy lower production costs and better return. Achieving high volumes (compared to the industry) is one of the main objectives of a firm.
There exist high growing markets with sustainable demand. As competition is weaker on growing markets - see section on the 5 forces - firms will focus such markets and seek to grow quicker than competition.
That was possibly a good approximation of the economic conditions in the early 70’s, however, this is no longer the case in many countries / many industries.
Typical prescriptions are associated with the four quadrants that each represents a specific category of product / activities:
Cash Cow are products in slow-growing markets for which the firm has high market shares. Such markets are assumed to be mature (they grew and now are stable or even starting to decline). Consequently such mar- kets should be unappealing to new entrants. Competition will remain stable or even decrease. The firm has high market share and should enjoy better economies of scale than competition and better returns. In the 70’s that led to the prescription of reducing investments (product, notoriety, advertising) and cashing in all the profit as long as feasible.
Dog are products in slow-growing markets for which the firm doesn’t have high market share. Again, this is assumed to be a mature, decline market. However as the firm has lower market shares, it is assumed that it suffers higher production costs which degrades its average returns on in- vested capital. Dogs are supposed to be ’end-of-life’ products / activities and the typical prescription is to disengage from these businesses.
Stars are products in fast-growing markets for which the firm has high market shares. The objective here is to maintain the competitive position so that when the market gets mature, the Star will become Cash Cow. The firm needs to keep investing in the product (technology, production pro- cess, branding, customer loyalty) to maintain its dominant position and sustain the growth rate.
Question Marks are products in fast-growing markets for which the firm has not (yet) significant market shares. Most products start as Question marks. However not all the products become Stars and if they fail to achieve high market shares before the market get mature, they may turn into Dogs directly.
The GE Portfolio Matrix
The GE (aka McKinsey) Portfolio matrix is a slightly more sophisticated version of the BCG Growth-Share matrix. It plots Market Attractiveness against Business Strength and usually uses a 3 by 3 grid (low, average, high) rather than a 2 by 2 grid.
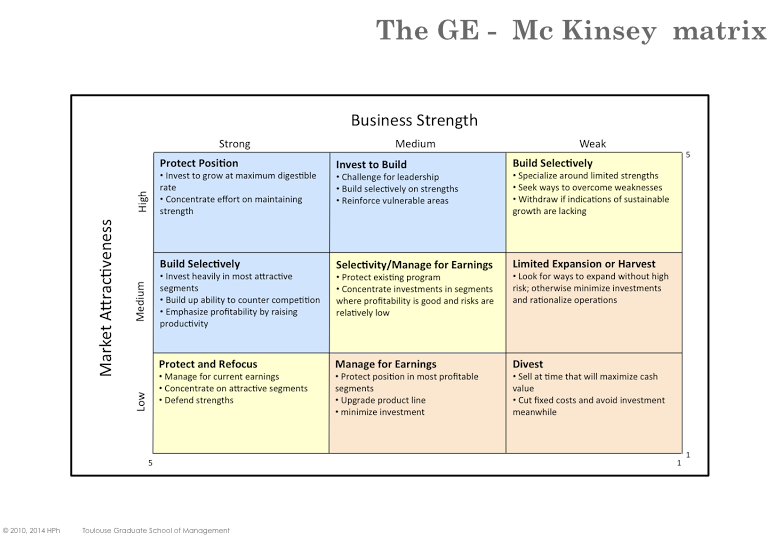
Composite Index
Whereas the BCG matrix uses growth as a measure of market attractiveness and market share as a measure of business strength, the GE matrix can use a vast variety of criteria. It can also either use a simple measurable parameter (e.g. attractiveness can depend on the average return of the industry) or consider a composite index (obtained as the weighted average of several parameters).
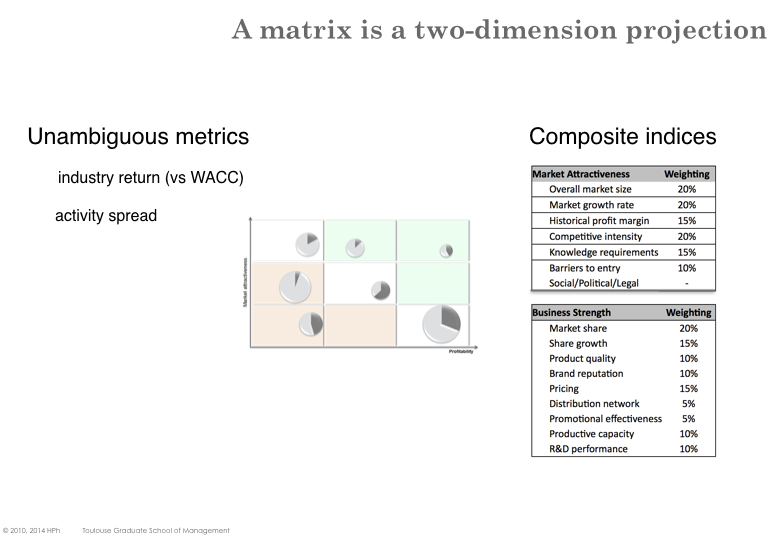
Composite index are richer (they take into account more elements and are more representative of a complex reality). However, it gets soon very difficult to avoid (very) subjective assessments.
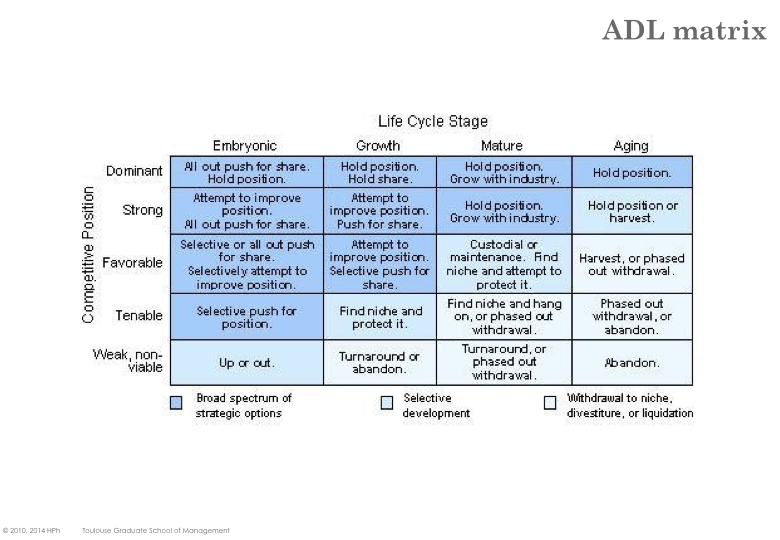
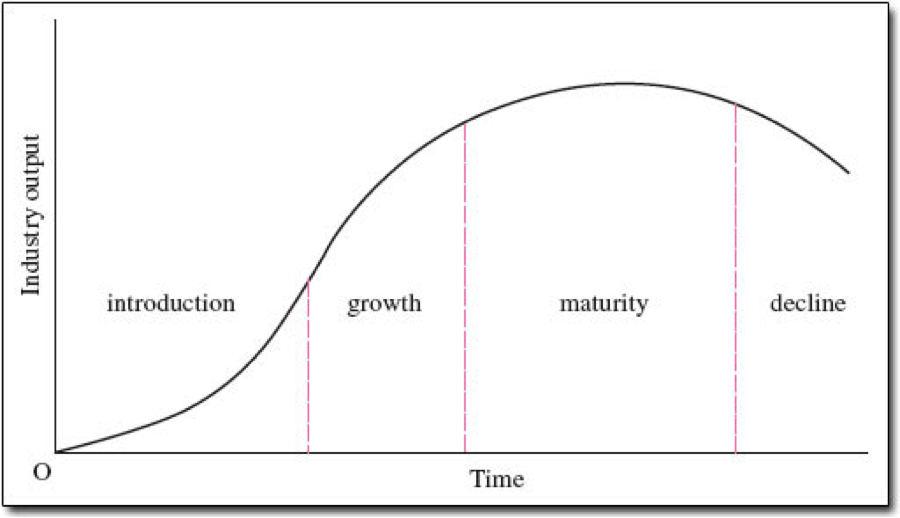
The ADL matrix
The ADL matrix is also known as the product life cycle portfolio matrix. It is similar to the BCG and GE matrix but put the emphasis on the life cycle of the industry / product.