Investment Performance
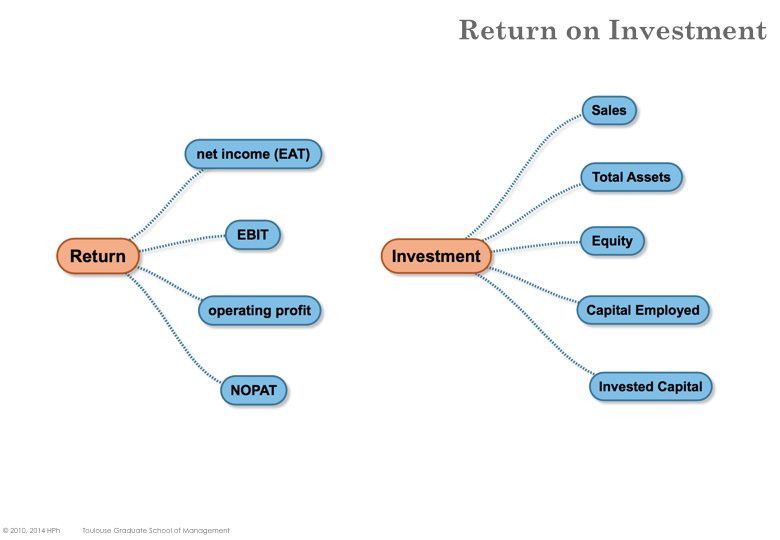
Return on Investment (ROI) is a broad term that encompasses many different ways of measuring the performance of an investment.
In general the absolute values of indicators are not meaningful per se. Instead, indicators are used to compare the performance of a firm to other firms from the same industry or across industries. Indicators can also be used to assess performance evolution over time.
Main Performance Indicators
Return On Sales
ROS (Return On Sales) measures the net earnings as a proportion of the revenue. In other words it assesses how much the firm capture value. \[ ROS = \frac{EAT}{Sales} \]
The definition may however vary and the ROS can be a synonym for either the profit margin (EAT over Sales) or the operating profit (EBIT over Sales). It is prudent to always clarify the definition (e.g. by stating EBIT over Revenue) and make sure that the definition is used consistently. It is therefore highly re- commended to always recompute indicators rather than using pre-computed indicators from different sources (e.g. web sites) and running the risk that different formula were used.
Return on Assets
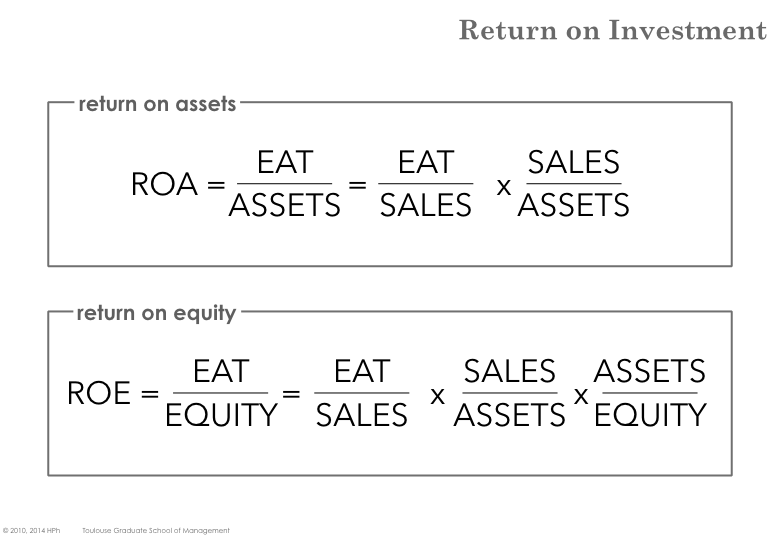
ROA (Return On Assets) evaluates how effectively assets (the size of the accounting balance sheet) are used. This ratio was designed in the 20’s at du Pont de Nemours & company.
Return on Equity
ROE (Return On Equity ) assesses the performance of a firm (and of its mana- gement) relatively to the investment made by shareholders.
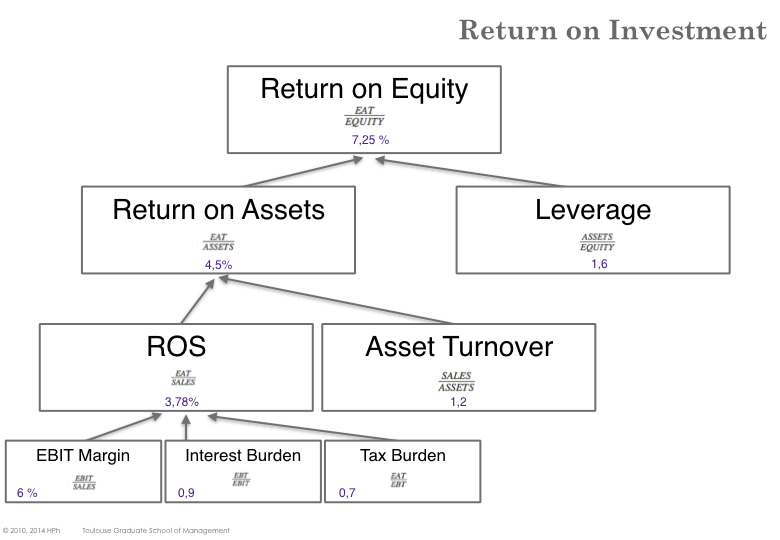
du Pont Formulas
Profit margin \( \frac{EAT}{Sales} \) denotes how much the firm captures value.
Asset turnover (or throughput) \( \frac{Sales}{Assets}\) measures how efficiently assets are used
Financial Leverage \( \frac{Assets}{Equity}\) indicates how debt financing is used relative to equity financing
The ROA can be written \( ROA = \frac{EAT}{ASSETS} = \frac{EAT}{SALES} . \frac{SALES}{ASSETS} = ROS . \frac{SALES}{ASSETS} \)
There are therefore fundamentally three ways to improve the ROA:
Increase the ROS (e.g. raise prices or reduce operating costs) while keeping throughput constant (same volume of sale),
Reduce assets (capex) to yield the same level of sales (i.e. improve productivity of the assets) at the same profit margin (e.g. sell & lease back some fixed assets, reduce WCR)
Improve the volume of sales for the same level of assets (increase productivity of the assets) while keeping profit margin unchanged
Likewise \( ROE = \frac{EAT}{EQUITY} = ROA \frac{ASSETS}{EQUITY} \)
Comparing Companies
Comparing each factor with companies in similar (or across) industry, helps improving the ROE. By and large there are three major types of industries:
High margin industries derive their earnings from selling at high price with high margin. ROS is the dominant factor in ROE. Increasing sales while not destroying margin can be challenging (e.g. ” haute couture” fashion, luxury industry)
High turn over industries certain sectors yield very little margins (e.g.retailing, low-cost businesses, …) but have very high turnover and can sell a significant multiple of their assets per year.
High leverage industries some industries can rely on very high leverage (e.g. financial sector) while offering rather small profit margin or asset turnover.
ROCE
Comparing each factor with companies in similar (or across) industry, helps improving the ROE. By and large there are three major types of industries:
While ROE and ROA are computed from the Accounting Balance Sheet, ROCE (Return on Capital Employed) is derived from the Management Balance Sheet. The objective is to focus on the economic value created (or destroyed) independently of the accurate structure of the income statement and balance sheet.
NOPAT
Non-operating and financial activities (non-recurring gain or losses) can significantly influence the net income of a firm on a given year. Likewise, interest expense depends on the financial leverage (how much debt) and do not reflect the performance of operations.
NOPAT is a way to approximate what a firm earns from its operations. NOPAT approximates earnings before interest after taxes (EBIAT).
\[ EBT = EBIT - I \] \[ EAT = EBT.(1 - T_r) = (EBIT - I) (1 - T_r) \] \[ EAT = EBIT.(1-T_r) - I.(1-T_r)\] \[ NOPAT = EIBT.(1-T_r) \]
It is noteworthy that very often the ROCE is computed from the EBIT instead of the NOPAT. This may be an issue when comparing firms that are not exposed to the same (average) tax rate.
ROCE
ROCE measures the NOPAT relatively to the size of the management balance sheet. That is it compares what is earned from operations to how much the business needs to run its operations.
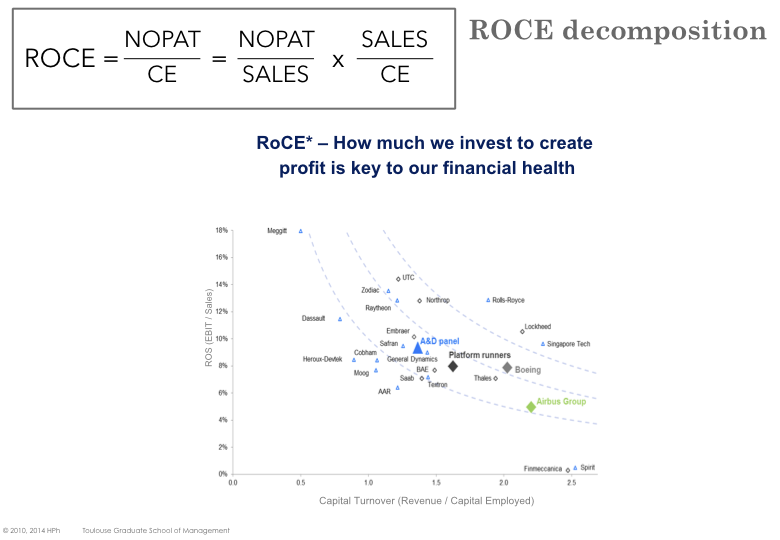
\[ ROCE = \frac{NOPAT}{CE} = \frac{EBIT}{CE} . (1-T_r) \]
One of the main drawback of ROCE is that Capital Employed represents the book value of assets. As a consequence, the ROCE tends to increase with time as assets depreciate and Capital Employed decreases. Longstanding businesses will therefore have higher ROCE than newer ventures. In addition, earnings are affected by inflation and will mechanically increase with time while Capital Em- ployed will not. Analysing the evolution of the ROCE of a company over time can be quite challenging.
ROCE decomposition
Economic Value Added
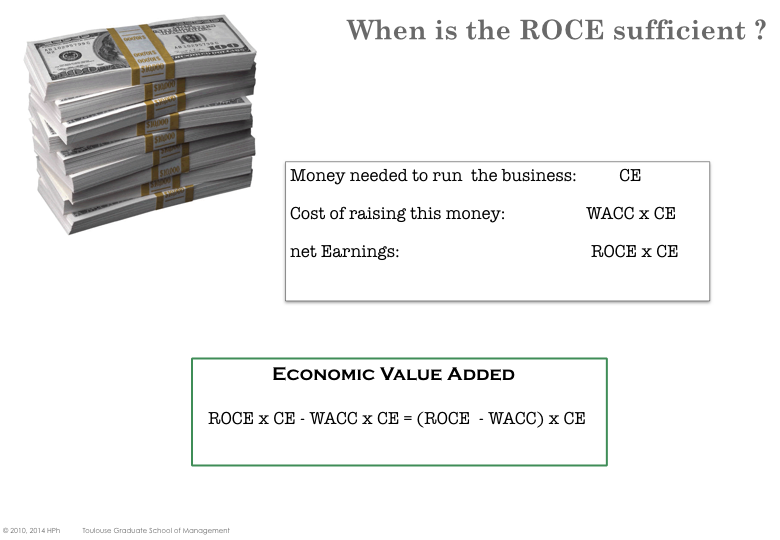
Capital Employed represents the amount of financing that a business needs to run its operations. Assuming all the financing comes from either shareholders of debt holders, the cost of financing the business is WACCxCE.
On the other hand, Capital Employed allows the business to yield ROCExCE by definition of ROCE.
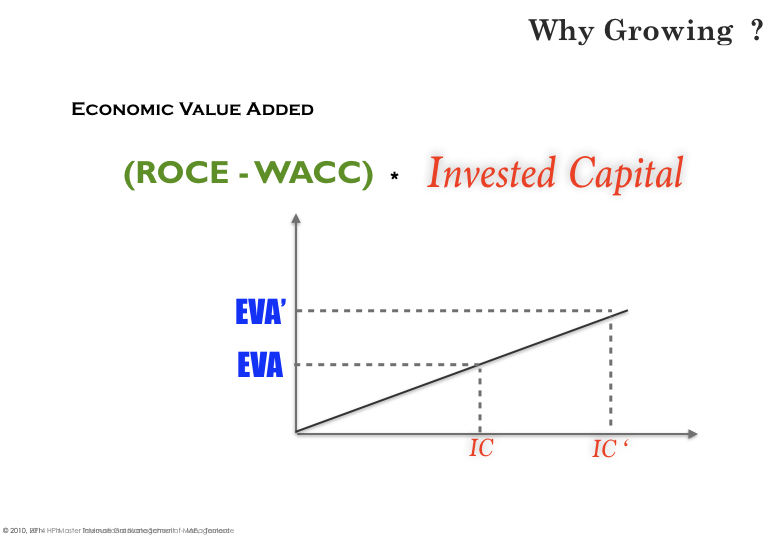
The Economic Value Added is the difference between what the firm earns (ROCExCE) and what the (opportunity) costs of running the business (W ACCxCE).
Growth fallacy
The difference ROCE − WACC is name the spread. It needs to be positive for the firm to create value for its shareholders. If the spread is negative, the firm is destroying value.